AMULATOR
AMULATOR is Actome's free online data analysis software to evaluate PICO assays.
1. Login / Registration
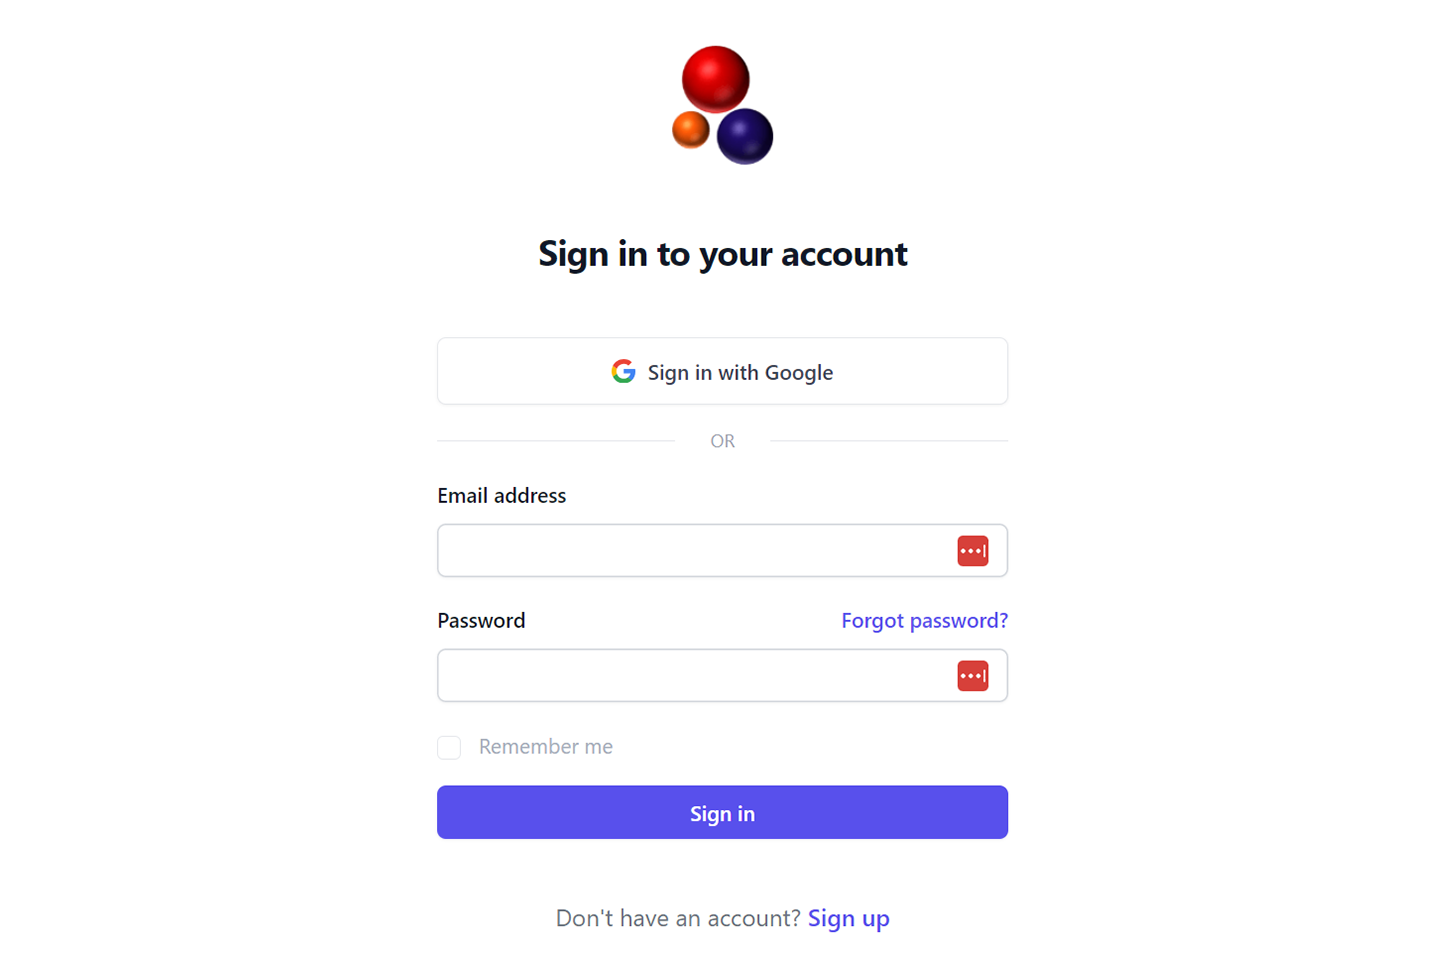
First-time users need to register first to our servers. Registration creates your own personal storage workspace, where you can upload and analyze PICO data, as well as access previous experiments. This ensures that only authorized individuals, specifically yourself, are permitted to access your data.
2. Upload your data
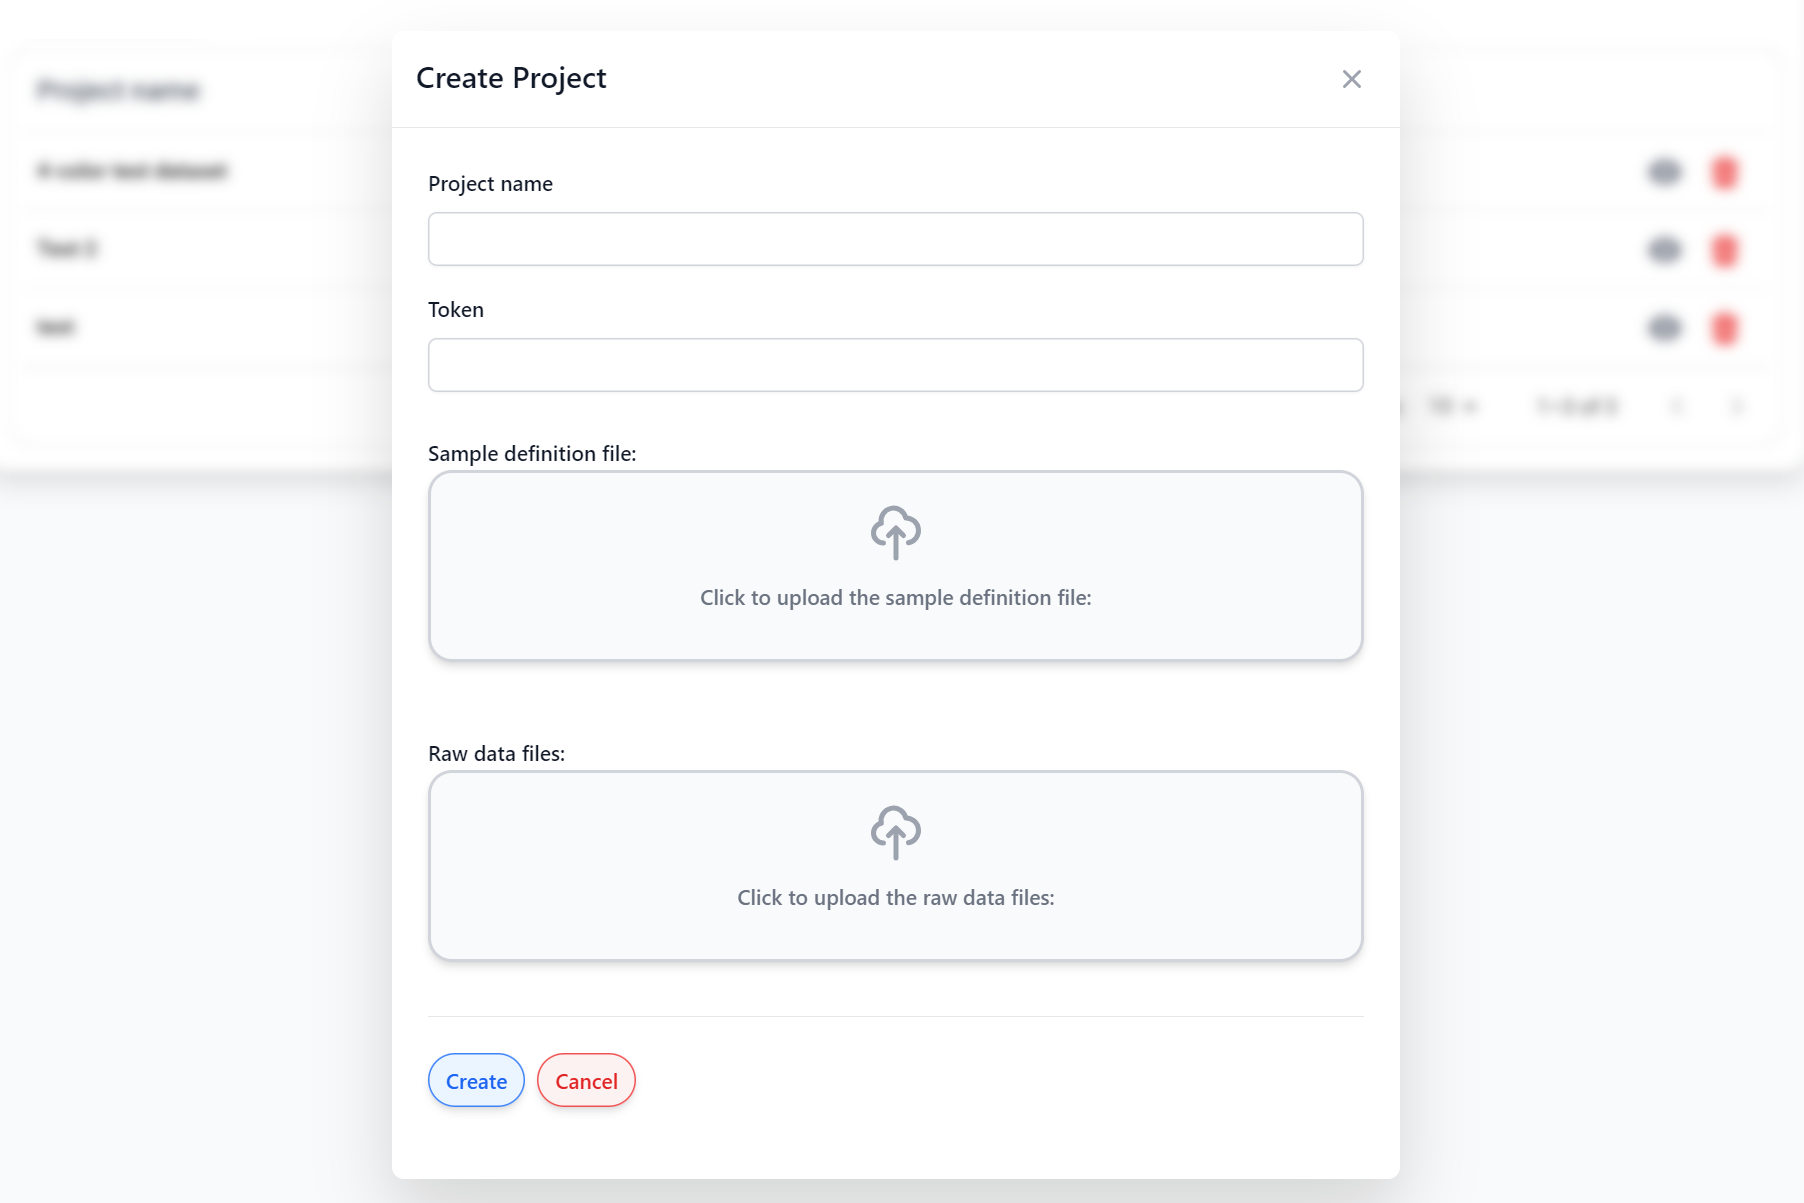
Upon successfully logging in, you are able to upload data to AMULATOR through the utilization of a token provided with each PICO Amplification Core Kit. The raw data derived from the QIAcuity Digital PCR System is subsequently uploaded, accompanied by a sample definition file, and analyzed by our server.
3. Data analysis
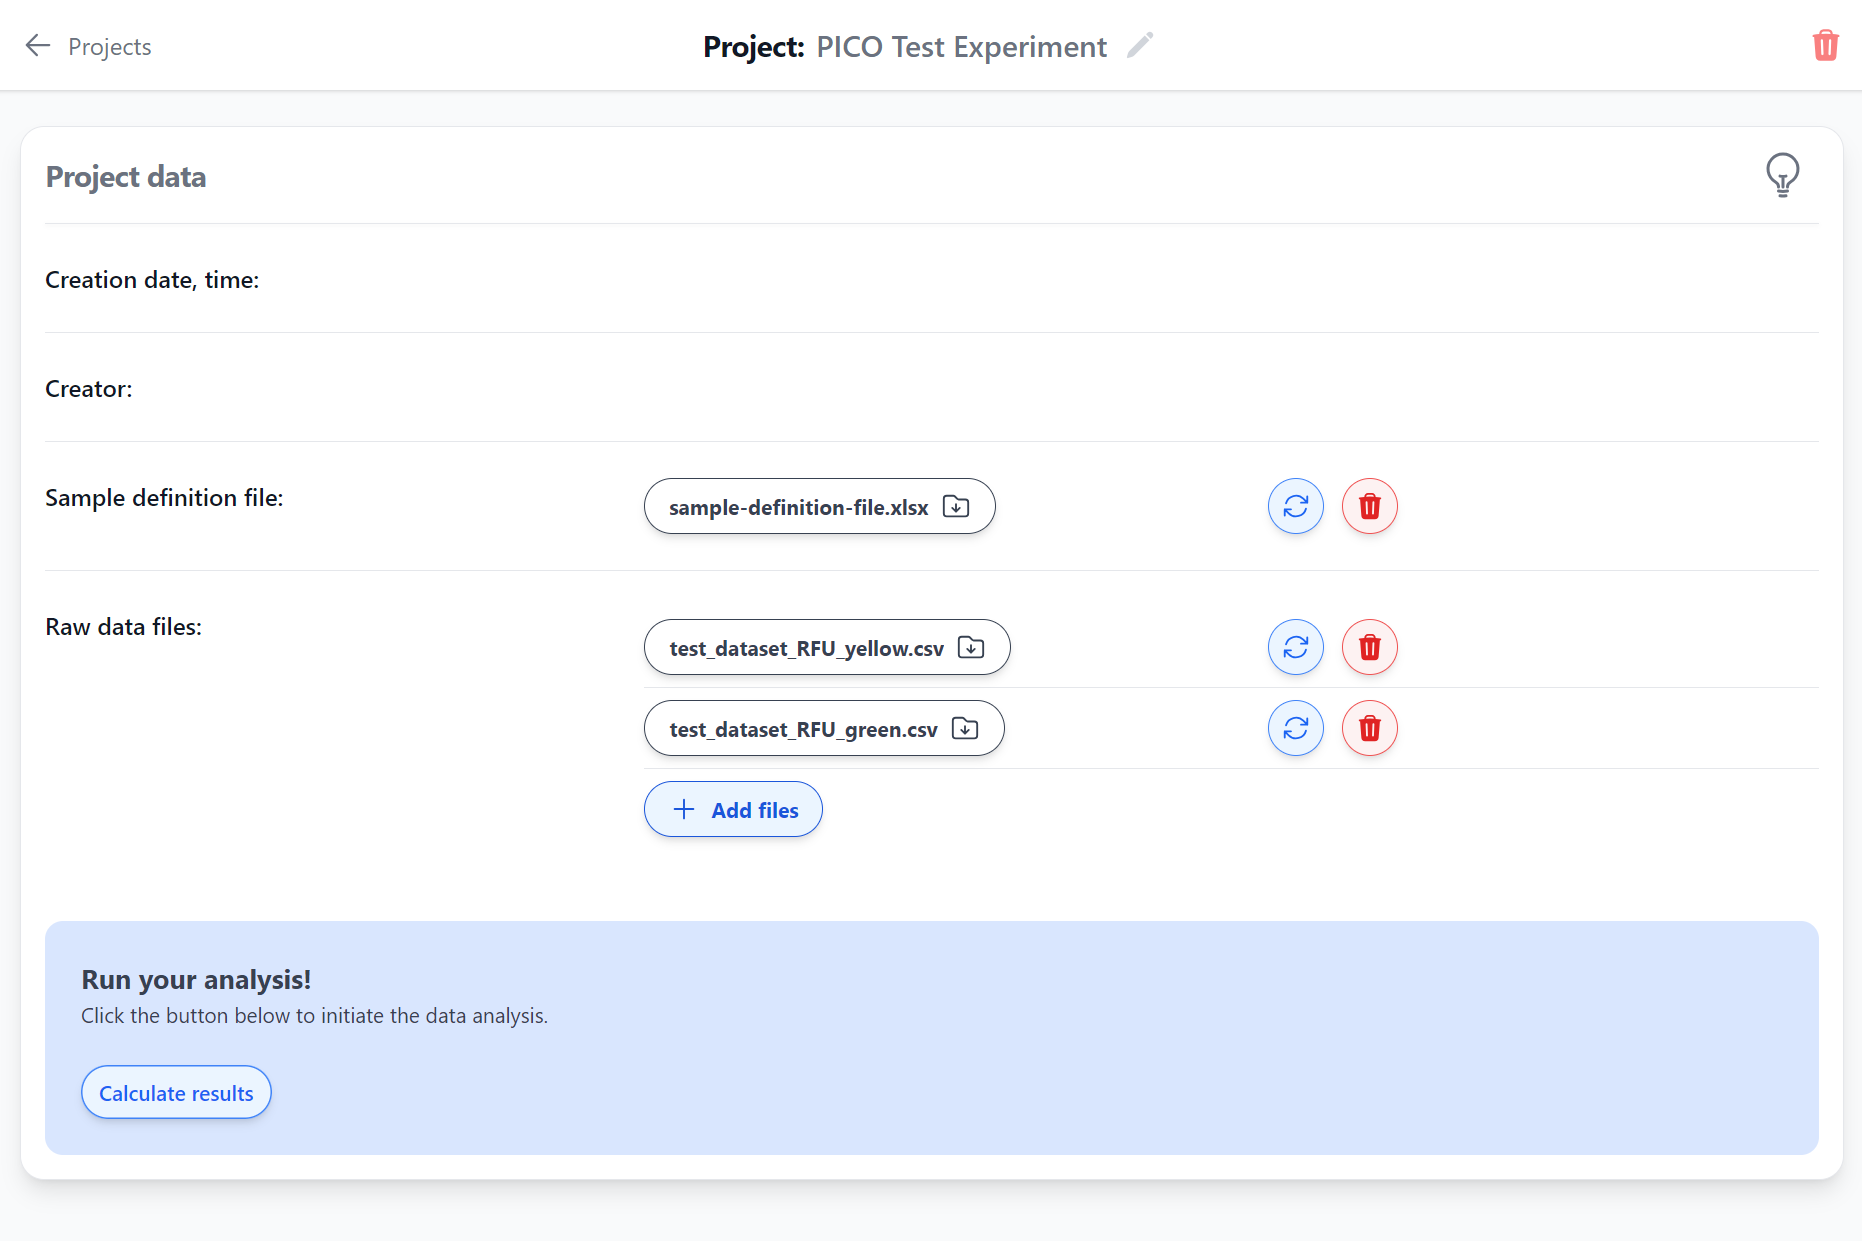
The initial data analysis procedure is completed expeditiously and generally requires no longer than 5 minutes, after which the results are delivered. Previous experiments are readily accessible, provided that the relevant files have not been deleted from the server.
Regarding the accessibility of prior experiments, it is important to note that any files that have been removed or deleted from the server may no longer be retrievable. As such, it is recommended that you take proper precautions to safeguard their data and ensure that all necessary files are preserved accordingly. By doing so, you can maintain seamless access to their data, allowing for continued analysis and comparison of experimental outcomes.
4. Results
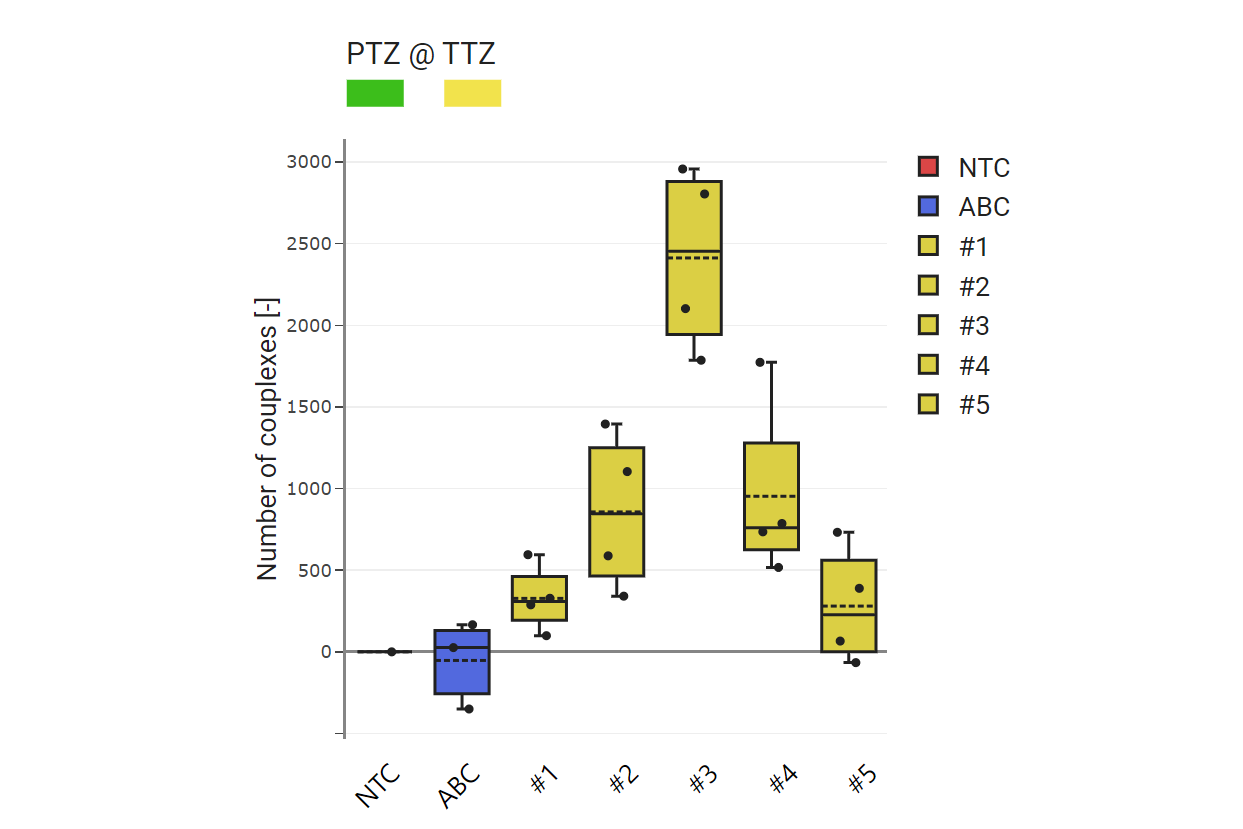
The generated results are presented in the form of a box plot graph, accompanied by fundamental statistical evaluations, conveniently accessible via the "couplex chart". You are able to reorganize data and discard any detected outliers as needed. The resulting graph may be downloaded as either raster files (as PNG files), or vector graph files, (as SVG files). In addition to the graph outputs, the obtained data may also be obtained and downloaded as a table of numeric values. This feature allows you to create and manipulate your own visualizations of the data, independent of the pre-existing graphical outputs.
Furthermore, a lambda chart is exhibited, enabling you to verify whether the desired lambda values have been attained. This chart may be perceived as a type of quality control measure, providing insights into the accuracy of the pipetting process.